Showing posts with label tectonic processes & hazards. Show all posts

Tectonic Hazards - Management Modification

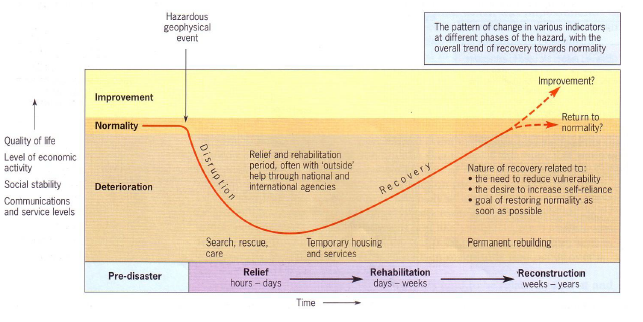
  • Hazard management cycle details the different stages of hazards
  • Methods can be divided into a modification of the event, vulnerability, resilience and loss.
Land Use Zoning:
  • Reduces disasters by stopping urbanisation on high land
  • Fewer will be ‘hit’ by a volcanic eruption, tsunami or earthquake
  • Hard to do in highly populated areas
  • Good for volcanoes then tsunami, but not as easy for earthquake
  • Bad if model prediction is wrong, easier to do in lowly populated areas e.g Iceland
  • New cites/developments could be built away from the risk zones
Lava Diversion:
  • MEDC countries like Italy have models to divert lava flow away from urban areas.
  • Lava hazards move slowly so it is easier to implement.
  • Requires skilled engineers to plan diversions and methods e.g spraying water and dynamite to move it.
Aseismic Buildings:
  • Best way to reduce disasters from earthquakes
  • Buildings are designed so they are strong enough or flexible enough to not fall down. Engineers include cross-bracing to strengthen concrete buildings or to get wood which is flexible yet strong.
Modification of Vulnerability And Resilience:
  • Ensuring populations are ready and can cope with the hazard
  • Hi-tech monitoring and prediction – Pacific Tsunami Warning System (PTWS), 26 countries have sensors as ocean buoys, a travel-time map is generated, people receive a text message. 
    • Reduces vulnerability and increases resilience 

  • Modify The Event
    (Mitigation Before The Event)
    Modify Human Vulnerability
    (Preparedness & Education)
    Modify the loss (response after event)
    Tsunamis
    Coastal defences (e.g. sea walls,
    Land-use zoning)

    Warning and prediction systems, coastal zone management and land-use planning, provision of emergency kits

    Loss modification involves immediate rescue efforts, followed by relief efforts e.g. NGOs which focus on food, shelter, water and sanitation.
    Insurance can help recovery.
    Long-term reconstruction is needed. Community action.

    Earthquakes
    Land-use zoning
    Earthquake-proof buildings

    Ground shaking and liquefaction risk mapping,
    earthquake education and drills,
    prediction not possible

    Volcanoes
    Lava diversion,
    Land-use zoning
    Monitoring, prediction warning and evacuation systems, hazard mapping e.g. lahar risk, education
    Shelters
Education And Community Preparedness:
  • MEDCs like the USA and Japan have education in schools and preparedness programs which are good
  • Practice drills, USA government has website to help people prepare
Modification Of Loss:
  • In the Haiti 2010 Earthquake – US emergency services provide search and rescue teams, short-term relief and aid such as medicine and water from Oxfam, long-term recovery aid from UK government e.g loans to rebuild the country.


Response
Volcanoes
Earthquake & Tsunamis
Do nothing Pinatubo lahar risk?
Haiti 2010?
Boxing day 2004
Modify the event (prevent)
Mount Etna, Italy
Hawaii Lava,
Iceland lava
Japan tsunami walls
NONE for earthquakes!
Modify human vulnerability (preparedness and evacuation)
Iceland 2010 ash,
Pinatubo eruption 1991,

MEDCs?
Japan 2011, New Zealand 2011,
California
Modify the loss MEDC – all? Haiti 2010, Mexico 2017


Tectonic Hazards - Hazard Management Cycle & Park's Model

Park's Model:
  • This model shows the impact of a natural hazard over time
  • Different hazard events have different impacts, shown by the speed of the drop in quality of life, the duration of the decline, and the speed and nature of recovery.
  • The differences in the 3 lines might be related to type of hazard, degree of preparedness, speed of the relief effort and the nature of recovery and rebuilding.
  • Pre-disaster; Relief; Rehabilitation; Reconstruction; same level?
  • Haiti had a big onset and there hasn’t been much recovery so the line would drop shorter.
  • Rapid onset is usually an earthquake
  • Slower onset is usually a volcano as the ashfall effect could take weeks to develop.
Hazard-Management Cycle:

Response:
Recovery:
Mitigation:
Preparedness:
Action by the energy services, aid agencies
Helps to ‘modify the loss’
Recusing buried or trapped people
Providing shelter, food, clean water.
MEDCs like the USA have excellent responses with helicopters
LEDCs like Haiti 2010 earthquake have poor response although international charities and aid from other countries e.g Oxfam, Red Cross
In the following weeks and months and years, the rebuilding process starts which is long and costly
Japan 2011 earthquake and tsunami was very expensive and slow but it was rebuilt better than before with more protection. Nuclear power station recovery could take years though.
Haiti 2010 was very slow and many are still homeless 7-9 years later.
Modifying the vulnerability and to try and reduce the risk
An effective type of disaster management: building codes, earthquake-proof buildings (aseismic) e.g NZ 2011 vs Haiti 2010.
Also, includes strategies such as preventing the hazard but this can rarely be done e.g Lava flow in Hawaii.
Includes warning system
Can be effective in saving lives especially if hazard has been predicted
Includes education, emergency kits at home
MEDCs are more prepared than LEDCs e.g California, USA and Japan have good preparedness whereas Haiti doesn’t.

Tectonic Hazards - Disaster Trends, Mega Disasters & Multi-Hazard Zones

  • Trends are changes over time which can include: Death, number of people affected and cost.
  • The number of earthquakes and volcanoes has been fluctuating recently but it hasn’t really increased
  • Flood events are rapidly rising along with hurricanes and lots of droughts.
  • The number of deaths is decreasing because High resilience between people, better building codes, better education, more money from governments and aid charities along with better health care.
  • The number of people affected has exponentially increased because of Big populations, more people living in urban areas which are not suited to disasters.
  • More economic damage because: we have more items which are more expensive, value of property has increased and more people are claiming on insurance
  • The number of reported disasters has also increased because the better technology to record disasters, more insurance to claim from disasters and more people = more chances of disasters.
Tectonic Mega-Disasters:
  • An extremely large disaster with huge impacts on a large scale.
  • Eyjafjallajökull volcano eruption, Iceland 2010, MEDC.
  • Ash from VEI 2 eruption spread over Europe, flights were cancelled across Europe, £1.1 billion in economic costs to businesses and tourism but there were not any deaths.
Multi-Hazard Zones:
  • Areas that have more than one hazards at once.
  • The Philippines, hydro-meteorological hazards. Mount Pinatubo 1991, the eruption had a volcano, typhoon and a flood all happening at once. The Philippines has a high vulnerability, low resilience, low capacity to cope and high-risk level to high hazard exposure
  • On a destructive margin where the Eurasian and the Chilean plate collided.
  • The typhoon caused flooding and high-speed winds at the same time.
  • Hazard profiles showed a high exposure to all the hazards at the time
  • In a subduction zone with a high earthquake zone.
  • Typhoon Yunya hit the area which caused floods. Rain mixed with ash which formed Lahars. 300 died from this despite evacuating the area for the initial volcano.


Tectonic Hazards - Predicting & Forecasting Hazards

  • No tectonic hazards can be predicted
  • Volcanoes show more signs of erupting and speed of onset is slower
  • Earthquakes happen quickly and show few signs
  • Tsunamis often happen after earthquakes so they can be easily predicted
  • Scientists play a huge role in prediction and forecasting, they often warn people to evacuate
  • Emergency planners are important in measuring impacts e.g Aid Workers to reduce deaths
  • Scientists cannot predict time or place even to within years. They can use hazard risks maps to estimate probability or a place even being hit by an Earthquake e.g in the next 5 years
Tsunami Predictions:
  • Caused by Earthquakes so we cannot predict the start of them
  • After an earthquake can track tsunami waves in the ocean (partial-perception)
  • Ocean monitoring stations called floats record pressure and how it changes
  • Computer models to create tsunami risk prediction maps
  • Warning is sent to everyone e.g Automatic text messages sent to everyone in Japan
Volcano Predictions:
  • Easiest to predict
  • However, we still cannot accurately predict them
  • Show most signs of activity and they have a longer speed of onset

Tectonic Hazards - Measuring Hazards

Different Types of Earthquake Measurement Scale:
  • Richter Scale: Measures the height of the wave. Loses accuracy in large earthquakes. It is used often so it is good to compare with. Used by scientists.
  • Moment Magnitude Scale (MMS): Measures the total energy released. Newer and more accurate. Doesn’t show the damage, but is designed to match the Richter Scale so the numbers are the same for each earthquake. Better for scientists.
  • Mercalli Scale: Experienced impacts, descriptions of damage. Measures intensity, easy to understand but has less flexibility. Good for practical purposes as you can access damage levels quickly. Good for locals and aid workers.
Richter Scale Examples:
  • 2-2.9: Hanging objects may swing
  • 5-5.9: Furniture moves, plastic may fall from the walls
  • 7-7.9: Buildings displaced, cracks in earth, underground pipes may break
  • 9 or over: Near total destruction, waves move through the visible eyes.
Measuring The Magnitude Of Volcanic Eruptions:
  • Volcanic Explosivity Index (VEI) is used to measure volcanic power.
  • Measures the volume of ejection levels (duration of eruption)
  • Humans have never experienced VEI 7 or 8
  • VEI means the size of the volcano
  • VEI 5-6 for Mount Pinatubo (largest in living memory)
  • Most eruptions are small e.g Hawaii was VEI 1
Hazard Profiles:
  • A way of listing characteristics of a hazard or profile.
  • Useful for insurance companies, government planners and aid charities
  • Allows for easy comparison of different hazards on the same profile.
  • Used to compare hazards with factors such as frequency.
What They Include:
  • Magnitude: How big the event is
  • Speed of Onset: How fast the event is
  • Area Extent: How big the area affected is
  • Duration: How long was the event
  • Frequency: How often the event happens
  • Spatial Predictability: How easy it is to predict where the event happens
Frequency:
Frequent:
Rare:
Duration
Long
Short
Area Extent
Widespread
Limited
Magnitude
High
Low
Speed of Onset
Slow
Fast
Spatical Predictability
Random
Regular/predictable
Temporal Spacing
Regular
Random


Tectonic Hazards - PAR Model & Earthquake Case Studies

What The PAR (pressure and release model) Includes:


Development
(Root Cause)
Population & Urbanisation
(Dynamic Pressure)
Housing & Locations
(Unsafe Conditions)
Disaster
Natural Hazards
How much money the country has (nationally) How many people live in town and cities e.g slums on the hillside in Haiti (local)
Earthquakes
Volcanoes
Tsunamis


A Real Life Example: Mount Pinatudo, Volcano, 1991:


Root Cause
Dynamic Pressure
Unsafe Conditions
Disaster
Hazard
Low-income country High population density in towns Houses built on river bank around volcanoes Volcanoes, ash fall and then lahars.


A Real Life Example 2: Haiti Earthquake, 2010:


Root Cause
Dynamic Pressure
Unsafe Conditions
Disaster
Hazard
Low-income country or corrupted government, lack of work High population They were not aware of the hazard, no responses. Poorly built houses, lack of food, building on steep slopes Earthquake.


LEDC Case Study: Haiti Earthquake, 2010:
  • 7.0 on the Richter Scale, the epicentre was in the capital of Port-Au-Prince, 250,000 died. The earthquake was expected as big earthquakes have low frequency in Haiti. High magnitude leads to lots of damage.
  • Aftershocks caused by the Conservative boundary between North America and the Caribbean plate. Pressure built up, released as seismic waves and released as secondary and love waves.
  • Hazards included: Landslides, ground displacement, shaking the ground. The vulnerability was high, so buildings collapsed. Most buildings were unsafely built due to corruption. Resilience was also low as response units were poor.
MEDC Case Study: New Zealand Earthquake, 2011:
  • 6.7 on the Richer Scale, fewer people died than in Haiti (183 only died). They were better prepared since the economy is much better.
  • Plate margin was constructive with subducting occurring on the coast
  • Earthquake released energy which caused ground shaking, liquefaction.
  • Buildings didn’t collapse as they had been built correctly. Liquefaction caused the most damage.
  • The focus was shallow so Earthquake was destructive.
  • New Zealand is stable MEDC, high levels of resilience with a better capacity to cope. Good economy services. Low vulnerability as people is healthier in better living conditions than Haiti. 
  • Deaths were lower but the cost of repair was higher as there are more expensive buildings, more insurance claims leads to more compensation payments. 
     
  • Root Cause
    Dynamic Pressure
    Unsafe Conditions
    Disaster
    Hazards
    Lack of investment Lots of old buildings, more money needed to repair the damage. Older buildings e.g Churches Earthquake


Tectonic Hazards - Degg Model & Vulnerability

Key Terms:
Hazard Risk – The probability or likelihood of a hazard occurring.
Disaster – A hazard becoming reality in an event that causes death and damage to goods/property and the environment.
Vulnerability – How easily and badly a place or people are affected
Resilience – How quickly and well a place or society can recover.
Degg’s Model:

Degg's Model - Wikipedia
  • A Swiss insurance company described a disaster as “an event in which 20 or more people have died or US$16 million value has been lost”.
Why Do Risks Vary So Much?
  • Unpredictability of hazards
  • Lack of alternatives
  • Locations vary so much
  • Changes through time.
Hazard Risk Equation:
  • Risk = Hazard x Exposure X Vulnerability
Management:
  • Natural hazards like volcanoes and earthquakes have a higher risk of becoming a natural disaster in poorer places where the vulnerability of the country is high and communities that are exposure which management strategies therefore low resilience.
Summary:
  • Risk depends on the factors like locations, such as: Physical geography, development level
  • Countries on or near plate boundaries are most at risk
  • MEDC’s have high resilience, less vulnerable and have lower risk but disasters still occur in MEDC’s
  • LEDC’s have low capacity to cope, more vulnerable and are more at risk from impacts.

Tectonic Hazards - Hazards (Primary & Secondary) In Tectonics Processes

Earthquake Hazards:
  • Crustal fracturing (ground displacement) - – cracks open up in the earth and land can rise and fall
  • Ground shaking – the ground moves rapidly side to side, and up and down, due to seismic waves
Secondary Hazards:
  • Landslides - soil and rocks are shaken loose, and rapidly fall downhill under gravity
  • Tsunamis - the earth’s crust under the ocean displaces water in an earthquake and creates huge waves
  • Liquefaction (when soil on the surface turns into liquid making quicksand because it is on soft earth) - the ground shaking causes groundwater to come to the surface
Types Of Waves In Earthquakes:
  • Primary waves – fastest but least damaging
  • Secondary waves – vibrations at right angles
  • Love waves – horizontal surface movement
  • Rayleigh waves – ‘rolling’ surface waves
Tsunamis:
How Does A Tsunami Occur/Form?
  1. An sub-marine earthquake occurs under the ocean at subduction zones, such as Japan trench 2011
  2. The fault slip thrusts rock up into the water
  3. A large amount of water is ‘displaced’ (this means moved to somewhere else!)
  4. The upwards ‘water column displacement’ of water is like throwing a pebble in a pond: the water ripples outwards
  5. As the waves approach the shallow coastal waters, the wave ‘backs up’ (front slows due to beach and back catches up)
  6. This means the waves become very tall and form a tsunami, flooding the land e.g. Japan 2011
Volcanic Hazards (Primary):
  • Lava flow - Lava flows are hot molten rock that has escaped from fissures in the earth’s crust. Burn buildings etc.
  • Pyroclastic flow - very hot ash clouds that are large particles too heavy to rise, so they fall quickly and sink/flow down the volcano side. Spread very fast and kill locals.
  • Ash fall & volcanic bombs (tephra) - fine particles of rock that have come from ‘vaporised’ magma – the pressure of the magma blows it to tiny pieces of ash that rise in the air. Damages lungs and aeroplanes.
  • Gas eruptions - the release of carbon dioxide & sulphur dioxide from volcanoes. Can suffocate people.
Secondary Hazards:
  • Lahars (mudflows) - volcanic mudflows when ash mixes with water (from rain or snow/glacier meltwater). They flow like concrete and flood and bury people and houses. E.g. Pinatubo
  • Jokulhlaups (glacial flooding) - huge floods that are caused by large ice-caps melting when a volcano erupts under the ice e.g. Iceland 2010